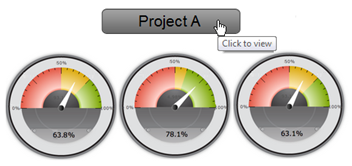
With dozens of products in development at any one point in time, staying informed of the overall health of current projects can be like trying to count cards at a 6 deck blackjack table while the croupier sings the 12 days of Christmas. Caplin have decided to develop the Project Dashboard (PDB) to allow managers to view just enough information about projects so, when necessary, they can speak to teams and then make informed decisions; without having to navigate through multiple sources for project metrics.
Other industries have taken advantage of mobile apps so managers can keep track of performance on the move. It is not uncommon for a city trader with negative P/L to receive a phone call from managers or stakeholders, as they sun their buttocks in the Maldives, with friendly advice (in the form of loud histrionics) on how to cut their losses for the day. A dashboard-like tool for a manager of traders may simply consist of P&L and current market positions. Can statistics for software development be collated and summarised as easily? And if it can, would the monitoring of these statistics benefit or hinder productivity.
What goes into the melting pot?
It is unrealistic to expect to be able to collate all the information relevant to the health of a project, however the following are a few examples of some of the more quantifiable ingredients that we here at Caplin may consider:
- Number of unresolved bugs
- Level of API documentation
- Test coverage
- Percentage of pipelines passing during builds
- The degree to which the project is on schedule (Burndown)
Ideally the PDB could encompass all the components above into a single percentage, however, the degree to which each element would contribute to the health would be project specific; which is why the PDB must be calibratable for each project (discussed further in part 2).
Potential Pitfalls and Counterpoints
Recording the Data
Recording these statistics may create an unnecessary burden on teams if the correct tools are not already in place to track them. Fortunately, at Caplin we have some third party applications such as Jira, Go and Jenkins which have APIs in place to help collect most of the figures we’d required, nonetheless, it is inevitable that some human interaction will be required to ensure some of the metrics (e.g. bug tracking) stay up to date.
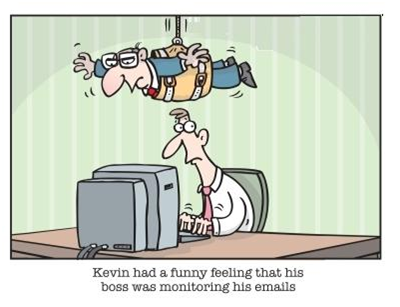
Do software developers need big brother watching?
While the trader, having smashed his keyboard over his knee for the 4th time that week, may need intervention from his boss regarding his current day of losses, is it necessary for software developers to be subject to the same scrutiny? Wouldn’t regular progress updates be enough? After all, only the team can really know whether the code is a few semicolons away from a healthy system, thus the only true way of getting a feel for how a project is performing is by talking to the team.
On the other hand, a team needs a manager snooping around for feedback like an if(true) statement needs an else. In this case a dashboard may serve to keep a snooping manager at bay, as well as reduce unnecessary meetings. With most software managers not knowing a for loop from a hula hoop [the preceding comments do not in any way apply to Caplin management], having a tool to keep them at arm’s length from coding can’t be a bad thing.
Could it lead to impulsive decision making?
Due to the capricious nature of the metrics, the biggest fear to developers would be that managers started making decisions haphazardly based on the metrics in front of them without first talking to the teams. We here at Caplin are extremely fortunate to have a rational group of managers, who would never fall into this trap. The worry of having managers taking a Yosemite Sam style approach to decision making on the back of PDB statistics may also be alleviated if the metrics were to hyperlink to more detailed information.
PDB should not be considered a way to have project teams under the microscope 24hours a day; it is likely that at times team members may not see the forest for the b-trees, a third party overlooking PDB can ensure problems don’t derail projects. And, in cases where certain metrics correctly identify deficiencies emerging, resources can be redirected accordingly.
Given good data gathering, realistic calibration and the statistics displayed being taken with a pinch of salt, Project Dashboard may be a valuable addition to the software development process. Part 2 will discuss some of the issues with developing and maintaining the dashboard amongst other problems that arose during its development.
Way to go Danny boy! A real breath of fresh air injecting innovation and humour to the market place.