
Story maps were an often mentioned conceptual tool at the Agile and BDD one day mini conference of 7 sessions in one location. See skillsmatter for the program and podcasts of the sessions.There were some great talks covering topics from business analysis through TDD to why developers and testers are both different and similar. In particular, Story Maps were mentioned by several of the speakers.
Story maps are a means of managing the Story backlog. Not just prioritising development based on business requirements as defined by acceptance criteria, but also put together with the ideas of Usage Sequence and Criticality.
The original idea was put forward by Jeff Patton in how you slice it, and further refined with Alistair Cockburn’s metaphor of a “walking skeleton” a few years later, e.g. the new backlog.
The main idea in the first talk at the conference was to stimulate debate of how we visualize quality in our projects. The use of Story and Effect maps was one of the ideas that Gojko Adzic put forward for an alternative visualization of quality. Trying to focus on the often used critical areas in our projects, rather than little used ones, even if they do represent a lot of code.
Later on in the afternoon there was a session on SpecLog. This is a tool that allows the specification of features based on acceptance criteria, and then arranges the tests for these features into a number of scenarios. In building up the test suite the percentage of completed and passing tests could be calculated from the scenarios within a feature, and test results displayed at the coarser or finer level.
On the SpecLog site in discussing requirements, they suggest that:
“Story maps can be used to visualize and manage parts of a product backlog according to a specific aspect such as roadmaps, a concrete actor goal or a minimum marketable feature set (or walking skeleton) of the product.”
This can help the whole organisation to visualise quality with respect to the original business goals as defined by the acceptance criteria. It looks like SpecLog can use the concept of Story Maps to help manage and visualise progress towards these goals.
SpecLog allows you to create story maps with implemented and not yet implemented features (and scenarios) so you can see how your system is building/progressing. Although they acknowledged that it is better to build maps physically on a wall – and then copy this into a tool.
Story Maps are built to represent a desired effect or outcome. Their use can help to:
- Focus on discussion
- Keep the “three amigos” (bus., dev. and QA) all involved. In fact at Caplin we use the “4” amigos: bus., dev., QA and UX.
- Provide a higher level context in living documentation.
SpecLog allows you to keep track of these features and scenarios, and stay on top of your Behaviour Driven Design especially within a .NET environment. SpecFlow use the same Gherkin parser as Cucumber. Thus far it all seems to be a very .NET based stack (at the top), but it was mentioned that it could integrate okay with JavaScript, so maybe there is more to find out. There is also SpecRun to run sets of SpecFlow tests.
These tools were originally targeted at .NET and Visual Studio users, but have proven to be so popular that they seem to have already seen off their main competitor Cuke4Nuke, see cuke4nuke-or-specflow.
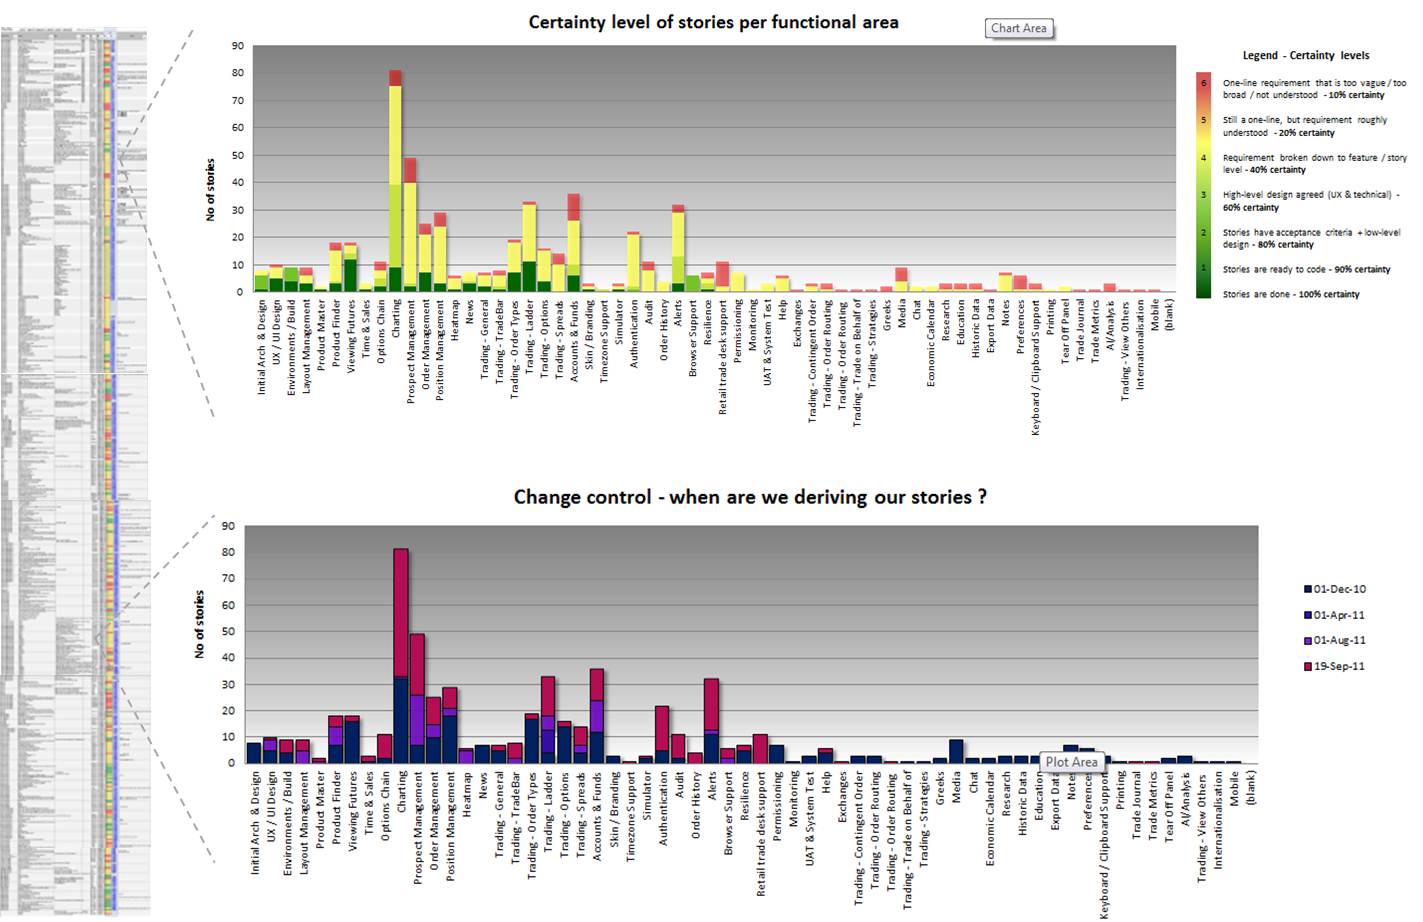
Previously we have used our own spreadsheets to prioritise the backlog (see below), however an integrated tool would make everyones lives a lot easier.
There are also reported to be Javascript and JIRA integration points for SpecLog. It will be great to find out more if there are.