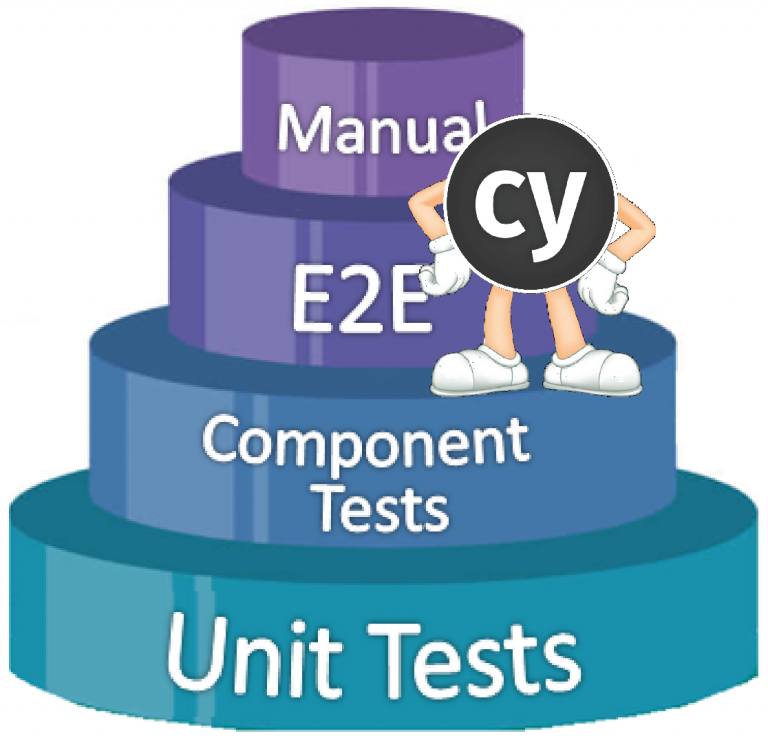
Here at Caplin, we loosely adhere to the principles of the testing pyramid. That is, we limit the number of tests that are typically time consuming (to write, run and maintain) and strive to provide as much coverage as possible at the lowest levels of the pyramid e.g. with Unit Tests, which are fast to run and easy to maintain.
However, our front end teams recognise that the tests that tend to catch the most regressions are those at the top of the pyramid, i.e. End to End (E2E) style tests. We also have a lot of non-functional requirements that require different levels of coverage. We recently adopted Cypress.io as a means to provide this coverage. Cypress is a JS based developer friendly tool used to write E2E tests for web apps and web pages.
Here are some of the ways we get value from using Cypress at Caplin.
End To End Testing
Caplin has multiple web based trading applications. Each core application also has what we call “variants” which provide bespoke functionality and styling to cater for our individual clients. We use Cypress’ out of the box mocha framework to write behaviour driven tests covering our apps core functionality. We can share common test code across applications but also run the same tests against separate app variants (with some overrides to cater for bespoke behaviours).
Each of our applications have around 30 E2E style tests. This provides a reasonable amount of functional coverage across each feature, without becoming a burden to run and maintain in our automated build.
- Average duration*: 10 minutes
- CI run frequency: every commit
*duration to build and run the tests for an individual application in our automated build environment.
Visual Snapshot Tests
Visual Tests (VTs) verify the UI appearance of the application. Initially, we were apprehensive about adding VTs to our automated test harness. Not because we didn’t think they would add value, but because of how much the tests would cost to maintain. Over time, the tests have proven to be extremely valuable, in catching styling regressions in hard to reach parts of the app that were otherwise missed by manual checks. It has been worth the additional effort required to ensure the tests were easy to maintain and did not introduce too many flakes to our builds.
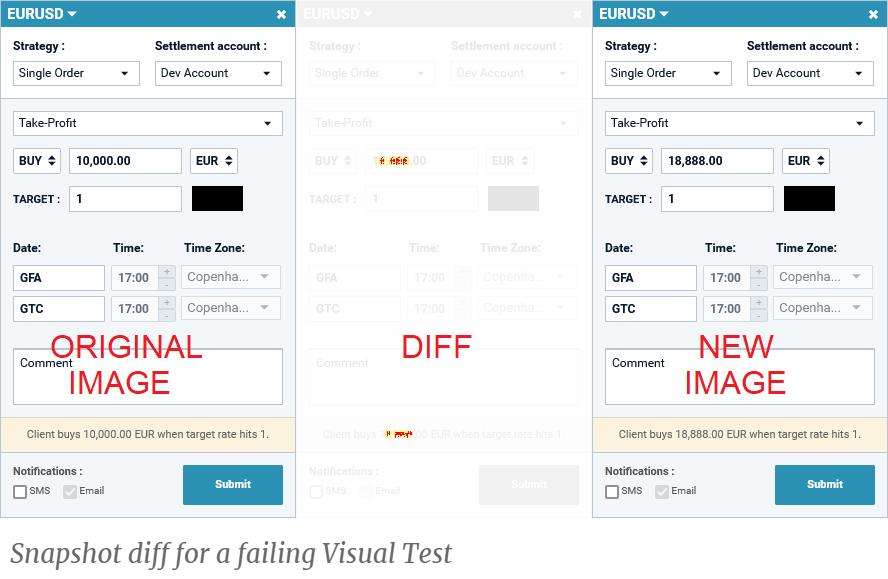
We have made some customisations to cypress-image-snapshot which allow us to have more control over when/how the tests fail. Also, on occasions when intentional changes cause the tests to fail, the alternative snapshot is made immediately available in the build, making it easier to update the benchmark snapshot.
Given the dynamic nature of our applications, we will have several elements on the screen showing streaming data. To workaround these elements in visual snapshots, we have added custom commands to either override the values or blackout those elements entirely.
- Average duration: 2 minutes
- Run frequency: every commit
Performance Testing
In modern browsers, web app performance has become less of a problem over time. But that’s not to say we shouldn’t stay on top of the CPU and memory consumed by each of our components, particularly since our applications can be used over a very long working day.
Each core component of our applications now has a Cypress performance test. These tests are essentially a simple happy path E2E test running several times in a loop, where we track CPU and memory for the browser process at given intervals for the duration of the test. To capture these metrics we have added custom Cypress commands utilising psaux.
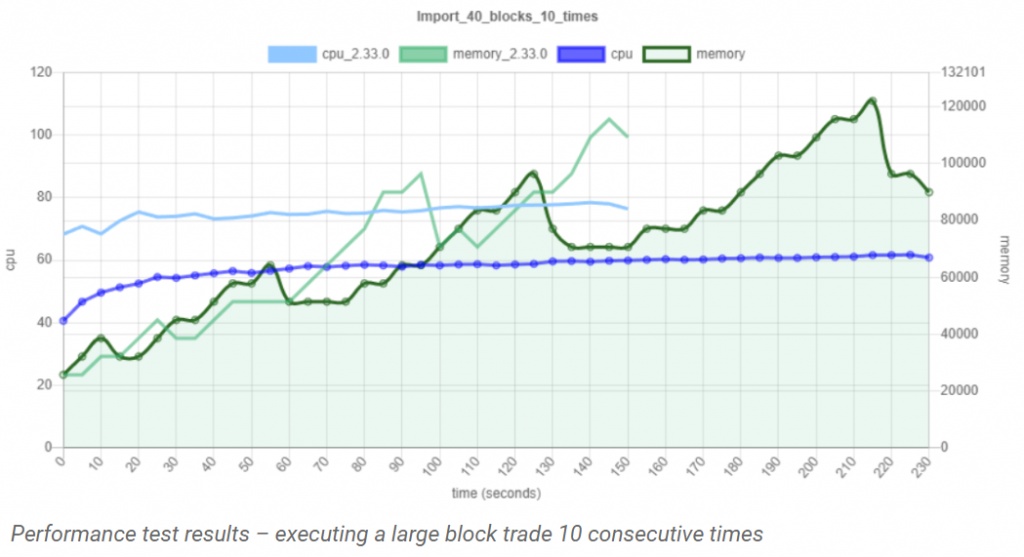
The nightly running tests are benchmarked against the performance results of the applications previous release. This allows us to easily spot recently introduced performance regressions. The charts are made using chart.js.
Caveats: since Cypress itself consumes memory by running in the browser and also performs actions at a speed not possible when performed by a human, individual results should be taken with a grain of salt. However, for comparison over time and for catching major performance regressions we still feel the tests add plenty of value.
- Average duration: 30 – 40 minutes
- Run frequency: nightly
Lighthouse Report
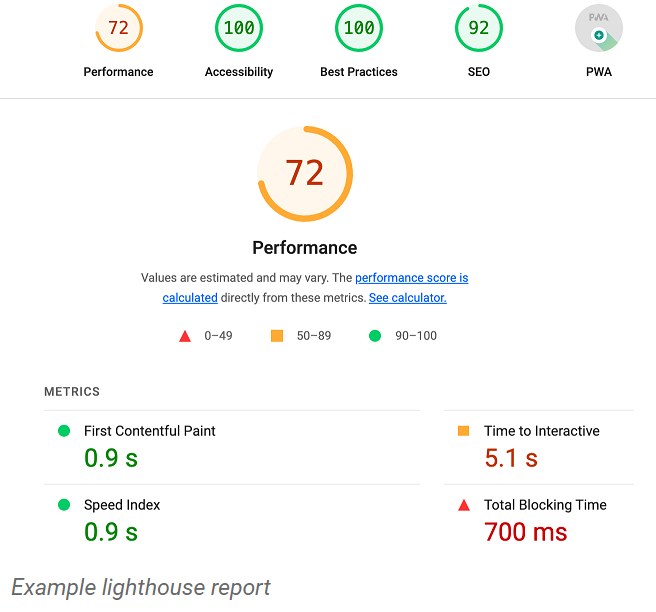
Lighthouse is an automated tool used to audit a web page and deliver a report on performance, accessibility and other web diagnostics. It is easily integrated with Cypress to generate a nightly report and can be configured to define acceptable benchmarks for each metric. While the report is generally more useful for static web pages than feature rich web apps, the tests are cheap to run/maintain and provide a quick way to catch major degradations to the aforementioned measurements.
- Average duration: 20 seconds
- Run frequency: nightly
Mock API Calls
One of the alluring features of Cypress is its ability to make HTTP requests, either on behalf of the web app or simply to test the API server in isolation of the front end. Our applications mostly handle streaming data with streamlink, so our need to make single API calls are limited. We do however use the cy.request command for programmatic authentication during tests. This allows us to speed up our tests by bypassing the login screen for most of our tests (other than those that test the login screen itself).
Test Reporting
We do not use a BDD framework (e.g. gherkin or cucumber), however we like to think our tests are written in a human readable form just by using the native cypress commands along with descriptive functions where needed. Our tests are named in such a way that the reports can be interpreted by our business analysts to gauge functional coverage.
While there are tools available such as Cypress Dashboard for post mortem result analysis, instead we use the default json results provided by the framework to plot failures over time to help identify problematic tests and flakes.
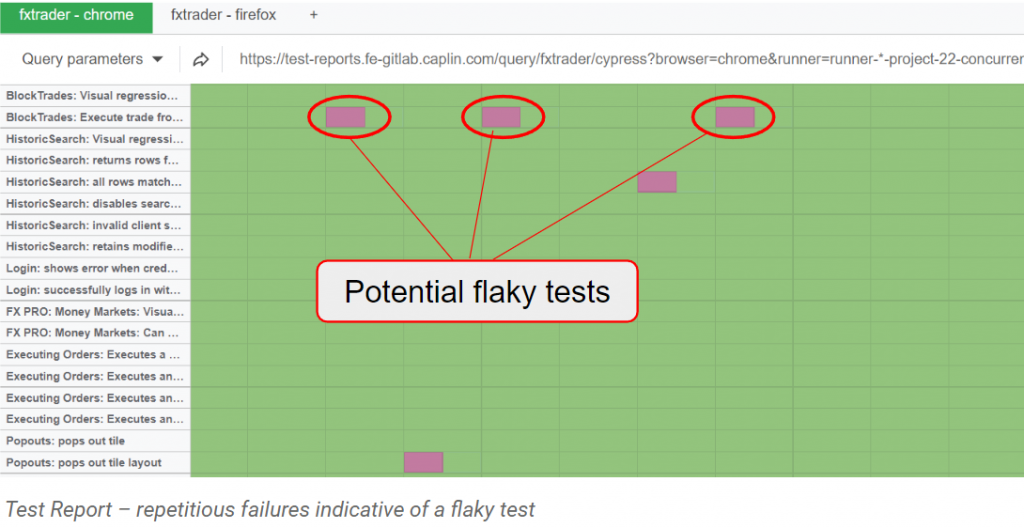
Our builds archive the videos and screenshots provided by Cypress for all failing tests, making it a lot easier to identify failure causes in our automated builds.
Other Perks
From a developmental perspective, one of the biggest draws of Cypress is the dev and debugging experience using cypress open. The UI allows tests to be run while watching for code changes, also being able to time travel through the test is a great way to find the source of issues.
Enabling automatic retries for tests in CI builds avoids the huge time sink of manually rerunning entire jobs that fail due to spurious reasons in individual tests. Our test reporting tools keep track of tests that notoriously require retries allowing us to address those issues at our own convenience.
Quirks and Pitfalls
Most of our applications have some components that support being popped out into a separate browser window. Unfortunately (at time of writing) Cypress does not have out of the box support for this, meaning we need to find alternative ways to provide coverage for this feature.
We have also encountered problems with running tests with Cypress 10 on our Kubernetes containers due to some known issues with tests failing to start. So we are stuck on Cypress version 9 until this is resolved (or a viable workaround is identified).
In Summary
Despite some downsides, so far, having Cypress as a pivotal piece of our front end testing stack has been a positive experience. It is very customisable, easy to maintain and provides coverage across multiple testing levels.
