Sometimes you need to convey a lot of complex information in a easily digestible manner. Something that gives an indication of state without getting bogged down in the nitty gritty. The FTSE 100 is a good example of this. A single metric that gives a gauge of prosperity for businesses in the UK.
On the support desk we need to convey how much load we are experiencing to the rest of the company. To do this we have our own support index which is calculated on a daily basis and emailed around the company. If we hit more than 250 we get denied crumpets until we close some issues.
The Problem
The main issue is that the stats are only generated once a day and a lot can change during the day as we close issues and change priorities. Also the plain text email is ugly and a bit confusing. We wanted something prettier, more meaningful and that would calculate the index in real time.
Like many, we use Jira as our issue tracker and the stats are derived using a formula which takes a given open customer support ticket. The ticket has a priority (Low, Medium, High, Critical) and this is used along with how long the ticket has been open for and how many customers we have in total to determine the overall score for that ticket. Summing the scores for all open tickets gives the index score. The index is generated and published every morning at 9am.
The code that currently generates the index is some PHP code that makes a series of direct SQL queries on the Jira database. This means it is quite complicated, requiring the use of temp tables and large thorny SQL statements. Every time we upgrade Jira this code needs to be changed to accommodate database schema changes and it is generally accepted as a ‘stop gap’. That has been in place for nearly 5 years! Extending this code to do anything new would be a nightmare.
We also want a platform to build new cool tools and utilities. We all hate timesheets but on the support desk we might log time to 10 different timesheet codes a day. This is a pain to keep on top of and god forbid you wait until the end of the week when you will never remember everything that happened on Monday.
The Solution
The goal was to have the same information as we have now but rather than having it once a day in the morning, for it to be updated in real time and for it to be readily available/visible.
It is possible to find quite a bit of information directly using Jira but we wanted more out of our app. We decided to use the most excellent Electron framework which uses a combination of Node.js and Chromium to build desktop applications. You have the rich eco system of frontend web development, with libraries like React and KnockoutJS, together with the power of the server side JS provided by Nodejs. It does feel a bit weird making database calls in the head of an HTML page but that is what Electron lets you do. It is also cross platform so will work on all of our machines.
The build
The first milestone was to list out all the active issues the support desk was dealing with and list them out on screen, so we needed find something that could get the information out of Jira. We knew it was possible with direct DB calls and for a mini-second considered directly accessing the database as the email code does. It would give ultimate flexibility but we all know API’s are the way and the light. Jira has a REST API and a number of people have written wrappers for it. We decided to choose which one by having a race. We all chose one node module and the first to list the issues and commit would be the winner. The module jira-connector written by floralvikings won out.
Jira has Jira Query Language (JQL) which is a DSL on top of SQL that allows you to search and filter issues. You can save JQL into filters that you can then use in Jira dashboards and we already have some that we use everyday. Sending out the active support issue filter through the API returned a nice Javascript object containing a ton of data on each issue. With this, we loop over each issue and render each one to an unordered list. Milestone one complete.
Milestone #2 was to calculate the Support index and so we iterated over each issue and calculate the stats for each issue using our formula and tot them up to a cumulative total. We had some issues with working days as we were including weekends in our “days open” metric but hit up google and there were Javascript functions that did the job. This is then refreshed periodically to pick up any changes to data and the stats reflecting when issues get created, closed and updated. We also checked the due date and if it had breached the SLA target time the issue would be highlighted in red giving a clear indication it should take priority.
Milestone #3 was to display the index as a chart. We used amcharts to display a pie chart of all issues and how many index points each had. This helps analyse the workload and set priorities. We wanted to do a line graph displaying the last 5 days stats but we didn’t have time to write the JQL required to pull up the issues as they would have been several days ago. I am not even sure if it is possible without getting a list of all changes made to an issue.
Milestone #4 was to add a helper for timesheets. Just listing out the customers that you have worked on in that day is a big help to remind you what you have done. So we listed out issues that have been updated today and added a timesheet box to take the number of hours spent on that customer. We ran out of time and could not get this feature working but a previous hackday project had proved this was possible using the timesheet API so it will be a matter of stealing their code and working it in.
These are just some examples of how we can use the support Stats to better tell the story of what the workload is like at any given moment and we can use the data to our advantage. We have lots more ideas and a powerful platform to implement them. Next steps are to look at a proper layout manager as the one implemented uses a very basic KnockoutJS model to hide and show div’s as you click on the menu. React is an obvious choice to make some components and lay them out.
In short, we took an existing solution and improved it by:
- swapping brittle SQL queries for clean API calls
- calculating the stats on demand throughout the day
- providing data visualisations to help understand the information
- nearly helped with doing timesheets
- provided a great platform for future development
We plan on improving the aesthetics of the Support Stats dashboard and having it displayed on a screen in the office in the support team’s area. [updated] it is now!
This will provide continuous and accurate monitoring of the workload at all times.
The Support Stats provide a good barometer of the workload and performance but now, it will be more accurate across the day and display the information in a way to provide further light to compliment the existing monitoring solution we have in place.
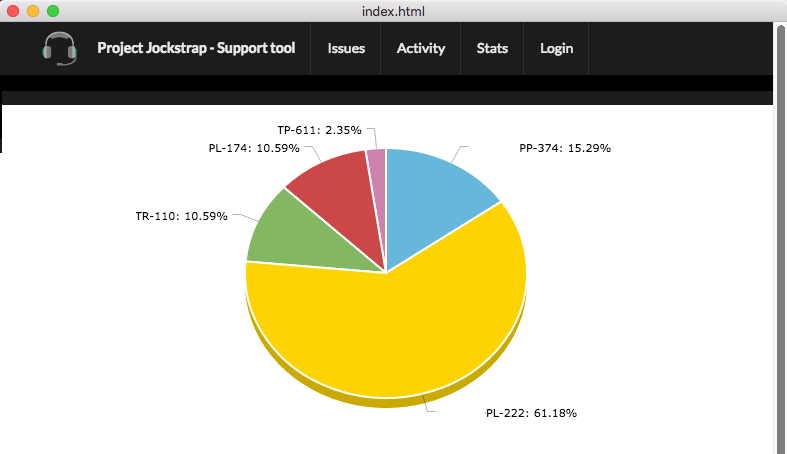
The End Product
Below are two screenshots of version 1 of the final product.
The two screens highlighted are the ‘Issues’ and ‘Stats’
The Issues tab lists all the open tickets, lists their relevant details, colour codes them green and red depending upon if the ticket has breached SLA and importantly, the amount of points it has.
At the top of the page, it lists the total support index for the whole board.
The Stats tab depicts the Issues tab with a pie chart. The chart is populated and proportioned accordingly with the opened tickets, the index point per ticket against the total index points on the board.
The Team:
Team Jockstrap: Toby Catlin, Mark Labuhn, Argen Babakhanlou