
The cloud demands a new mindset when considering availability of components. It is important to remember that there are no guarantees in the cloud, and it is the responsibility of the application to be self healing if there should be any loss of connectivity.
Implementing appropriate Service Level Objectives together with good monitoring and alerting systems can help to create this self healing infrastructure.
Proactive full stack monitoring
Observability means that the entire application network can be visualised and monitored. Ideally this will be within a single system, providing a single point for observation. It should also provide visually arresting alerts if there are anomalies within the network. These should be accompanied by appropriate alerts to other systems via email, Slack, instant messaging, or other integrated messaging systems.
Discovery, which lies at the centre of the Caplin Platform network, can be integrated with other technologies to provide multiple levels of observability. Ideally you would want to monitor the frontend components, each discrete component within the Caplin Platform network, and the health of any systems or services providing data to that network.
Monitoring nirvana would be to detect and be alerted to an issue in a downstream service you are dependent on, and to be able to mitigate that before there is any effect on your own end users. The next best thing is to provide those mitigations as quickly as possible, so you already have the answers for your end users as soon as they contact you.
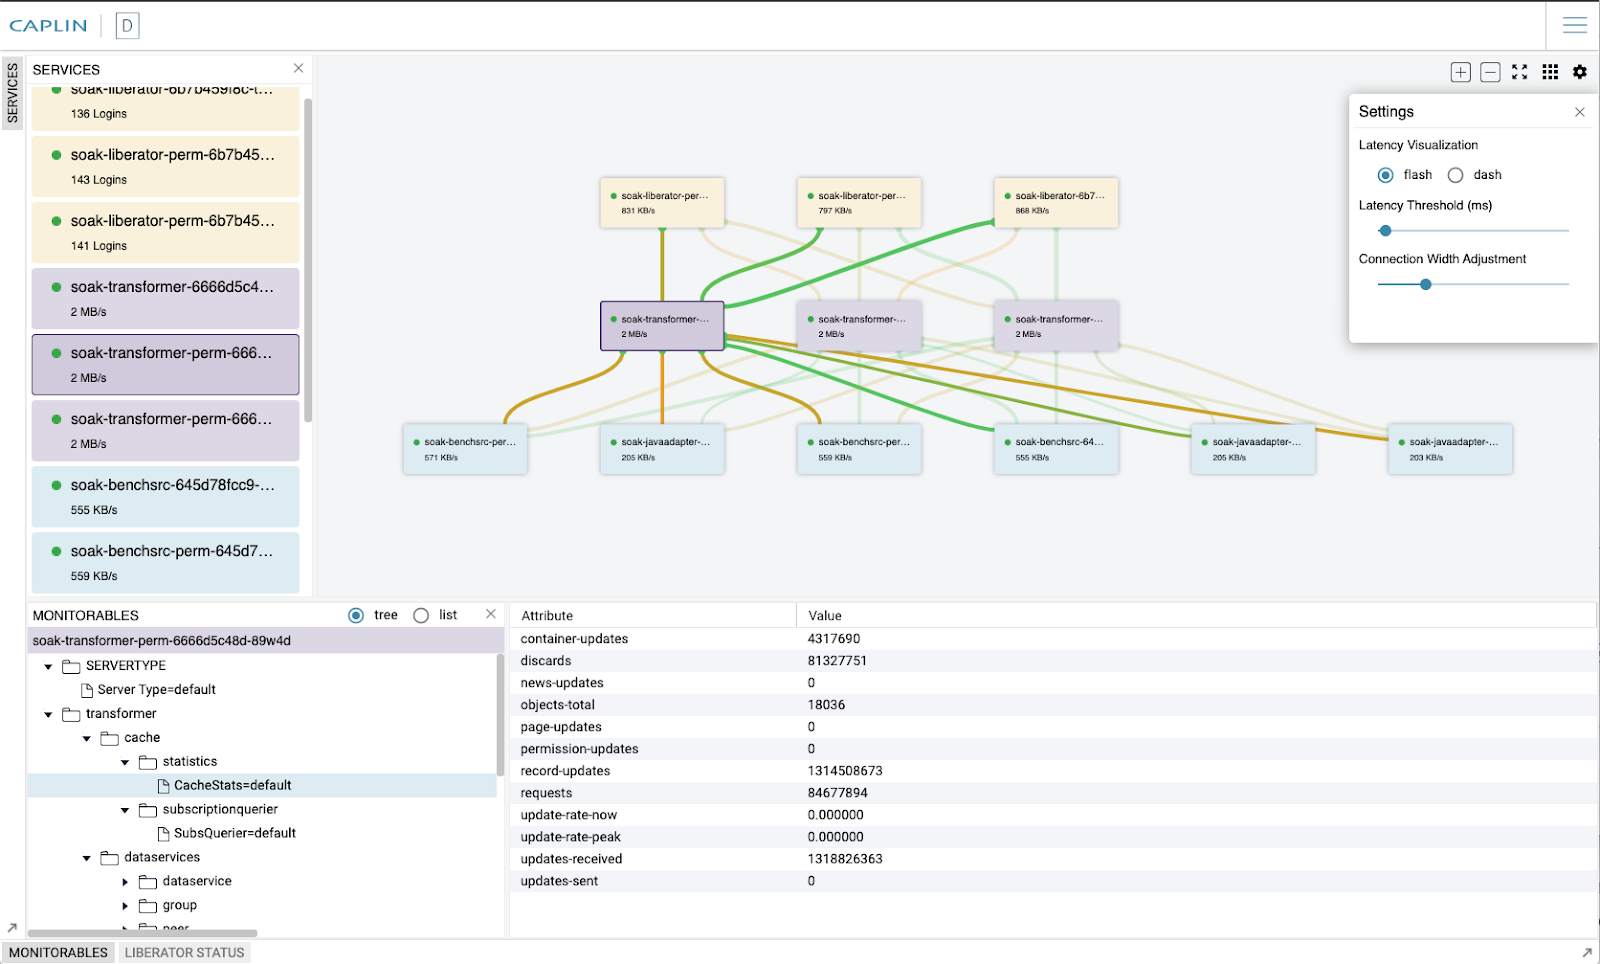
Discovery GUI
The Discovery GUI includes a latency visualization tool that can alert you to latency bottlenecks in your network. A popout configuration panel allows you to configure the latency threshold for alerts and how the alerts are visualised on connections between components: flashing orange lines or moving dashed lines.
It is also possible to hover over any line between components to see the current rate of data transfer between those components.
Latency visualisation is a powerful tool when on a display in your network operations centre that will clearly indicate if there is a latency issue within your Caplin Platform network.
This can also be integrated with Prometheus, or other monitoring tools, to provide alerting if the latency threshold is breached.
Prometheus and Grafana integration
The publication of Prometheus style metrics is built into the Caplin Platform. Both Liberator and Datasource Adapters can be configured to publish these metrics. Prometheus can be further integrated with Grafana to visualise these metrics. Prometheus can also be extended with alertmanager to allow alerts to be propagated to email and instant messaging systems.

Prometheus style metrics can also be integrated with your existing monitoring systems.
Integration with other monitoring systems
You may have an existing monitoring system such as AppDynamics or Geneos. The Caplin Platform already includes JMX beans, but we wanted to extend that monitoring system to embrace the cloud paradigm with Kubernetes. Adding Prometheus metrics endpoints allowed us to do that. Appropriately configured Prometheus auto-discovery within a Kubernetes cluster will allow not just monitoring of the Caplin Platform components, but the entire Kubernetes cluster.

Summary
Service Level Objectives should be a keystone within your Dev Ops practice. And having the answers and mitigations for your end users before they even know they need them will keep them happy, your business running smoothly, and save money. Providing full stack monitoring will allow you to realise these key business objectives.