For this season’s hack day our team, Jack Cusack, Harry Hornby and myself, decided to focus on reducing the complexity and improving the transparency of price administration of an FX trading system without reducing or restricting the functionality, and having any modifications applied immediately.
As many users of trading systems know, rules for margining clients can quickly become very complex as pricing requirements organically evolve. Typically these requirements are expressed as conditions that are chained together with particular rules that can result in many possible branches and convergences, however they are often displayed in a tabular format that does not lend itself to quick inspection – particularly for compliance users who are not involved in the day-to-day administration of such a system but who are very interested in being able to determine why a particular company or user is being priced as they are.
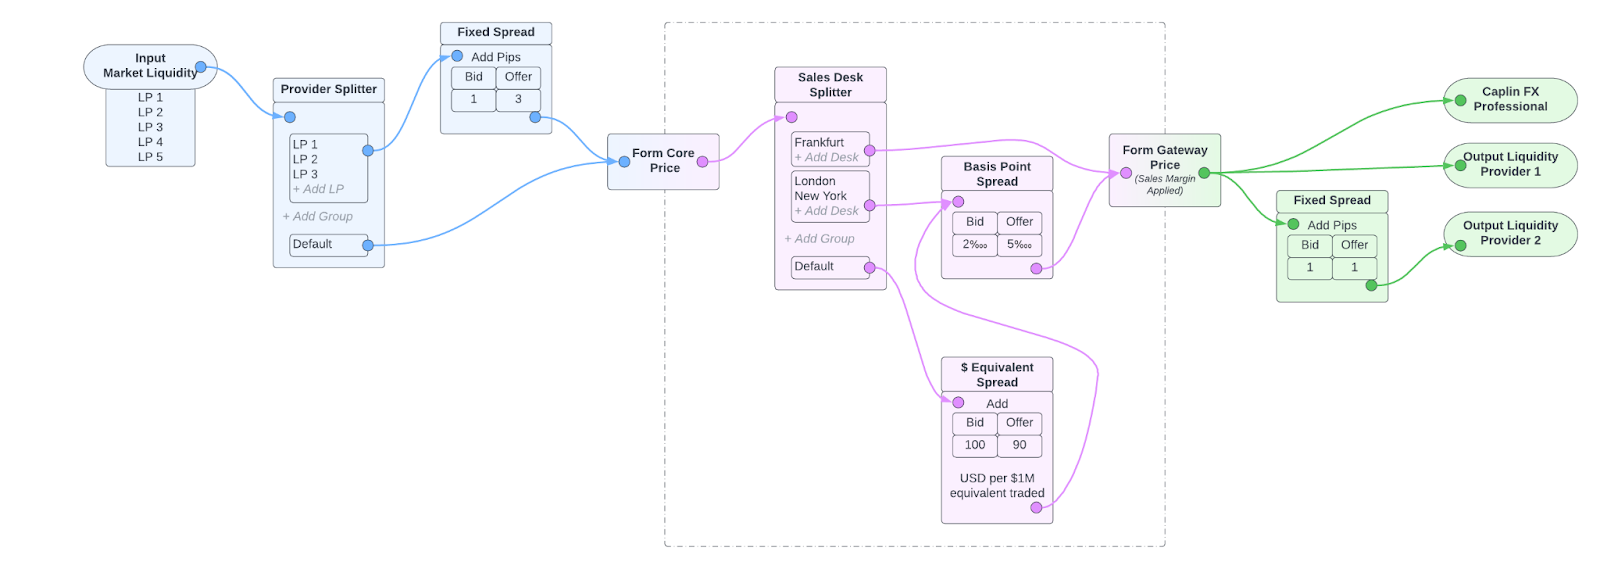
Taking inspiration from UI components such as Node Graphs in Unreal Engine and working with the concept that from the market to the client, all the configuration and components that go into servicing a price request can be modelled as a stream of data, we put together a quick “back of the napkin” concept diagram.
To explain this we’ll move from left to right.
In blue we have the trader price management:
- We’re receiving market liquidity from 5 LPs in Input Market Liquidity.
- Then we’re applying 1 pip margin to the bid pricing from LPs 1-3 and leaving 4 & 5 untouched.
- Then we form a core price aggregated from all these modified or unmodified prices.
In pink we have the client price management:
- We start with the core price and then split clients by the sales desk they belong to.
- Clients belonging to the Frankfurt sales desk visit no spread nodes, so have no spread applied to the core price.
- Clients belonging to New York or London visit the basis point spread node, so would have 2‱ applied to the core bid price.
- Clients belonging to any other sales desk visit the $ equivalent spread node, and then the basis point spread node. This means first having $100 per $1000000 equivalent spread applied to the core bid price and then 2‱ applied to that.
In green we have price distribution management:
- Output Liquidity Provider 2 charges a bit for each trade, so we add 1 pip to all bid prices going to it to offset this.
- The others, including Caplin FX Professional users, get the client price unchanged.
From this we then narrowed the scope down to what we thought we could achieve in the 24 hours allowed (minus time for sleep, looking after kids, and getting a presentation ready, this really isn’t a lot!) so decided to hone in on the client margining indicated by the pink area of the diagram.
We already knew that we could quickly utilise the flexibility of our Caplin One product for the back end implementation through a quick REST API and a couple of hundred lines of Kotlin to perform the margining based on the incoming config, but the UI was more of an unknown. Fortunately we discovered the react-diagrams library which we determined we would be able to use without too much hard work. Then after some consideration the components we decided to add were:
- A “Sales Desk Splitter” node, to route a group of clients through the graph according to the primary sales desk that deals with them.
- A “Fixed Spread” node, so any price request following this path through the graph would have a fixed spread defined in pips applied.
- A “System Spread” node, so any price request following this path through the graph would have a variable spread applied – a value of 1 in here would make $1 profit for every $1000 equivalent of the quote product traded. This provides consistent profitability across all product pairs, and so makes a nice default.
There were many other nodes that we would have liked to implement, the obvious ones being per product splitters, per product pair splitters and client splitting based on other metadata, as well as some other spreading nodes and very interesting introspection tools, but we’ll have to save those for another day.
Once we started working everything went extremely smoothly, especially compared to previous hack days, and one relatively relaxed 24 hours later we had a rough implementation working and ready to demo – you can see the results below.
Obviously the styling leaves a bit to be desired, but as a functional proof of concept we were pretty happy with it, and it seemed to impress the guest judges from Standard Bank, netting us a respectable second place.